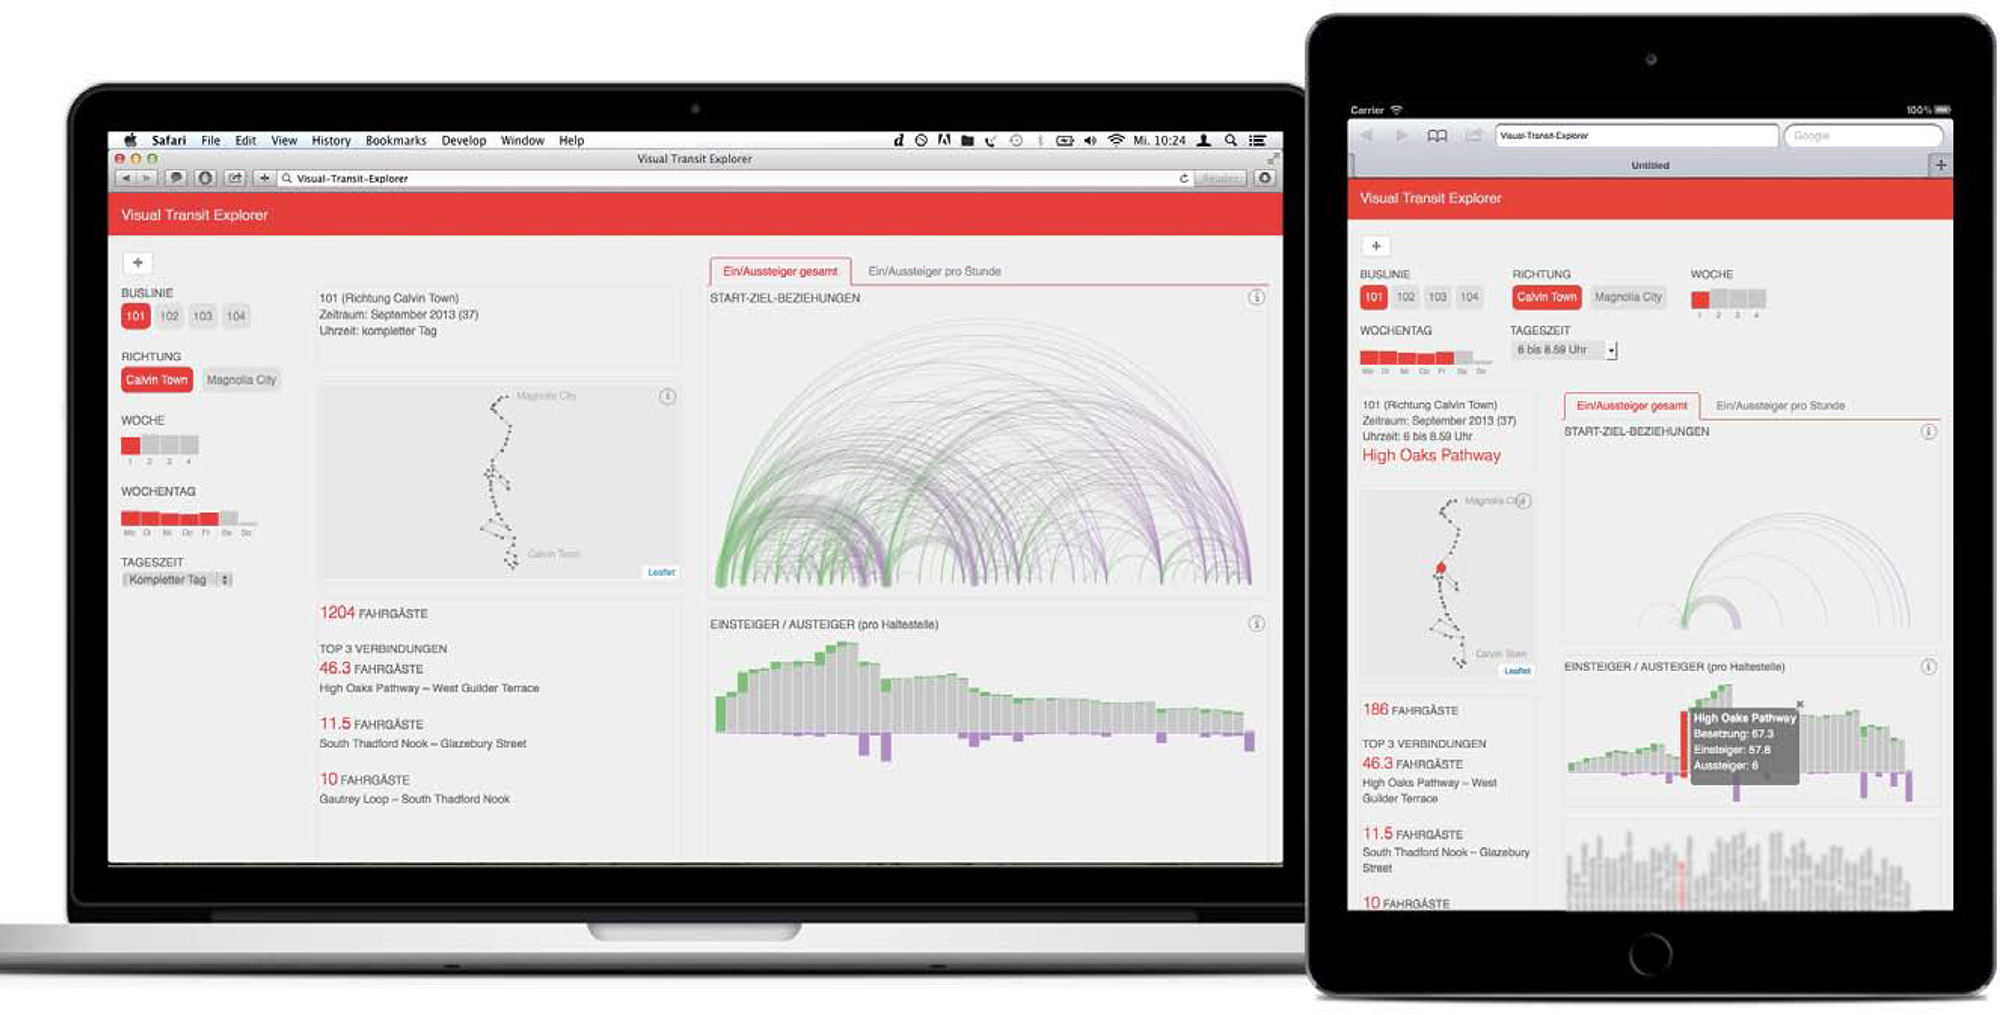
This interactive and responsive webpage visualises passenger numbers of public transport as part of an experimental project. This project was in collaboration with a German transport system. The page is intended for internal use only, that's why the screens show dummy stations only. The user can select a service and then explore travel patterns by time and day. There are two main visuals: The first focusing on the total number of passengers that are getting on and off the bus. The second one focuses on the number of passengers per station per hour.
I designed and finally build the webpage in Javscript using D3, PHP and SQL.
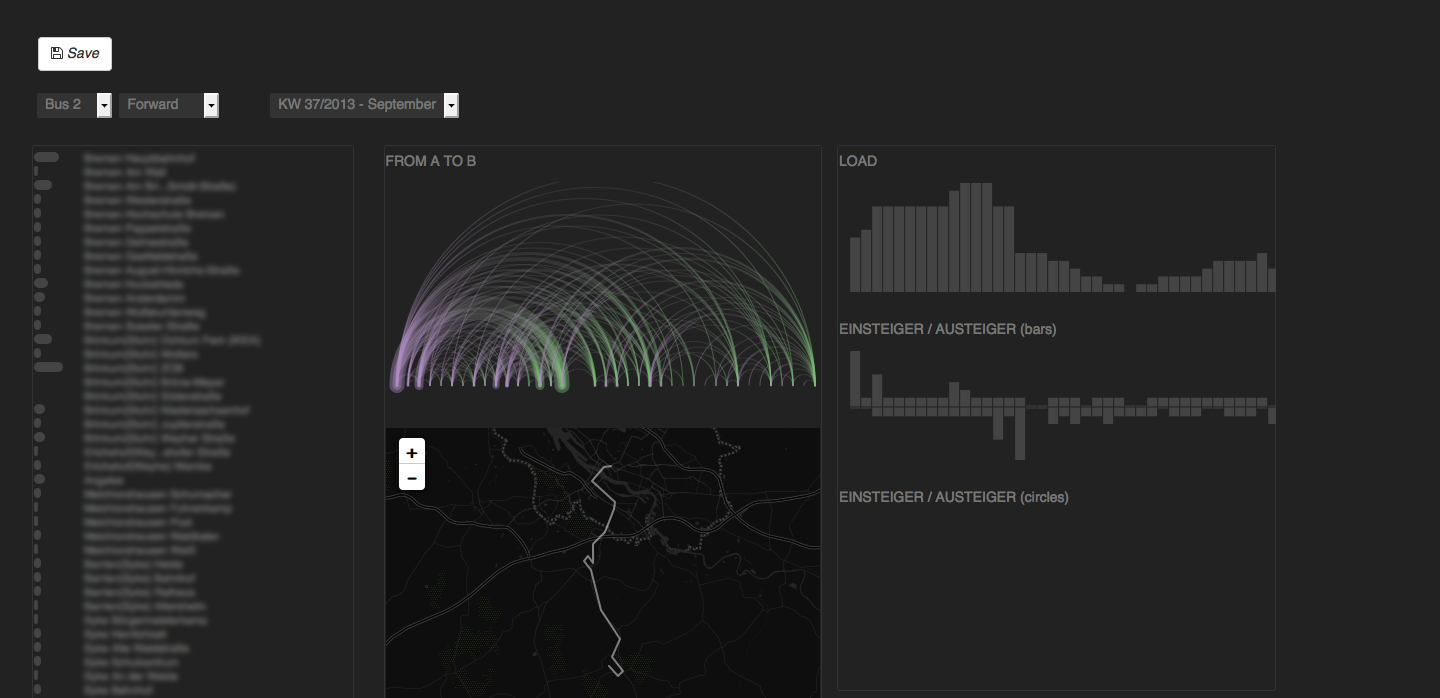
Final product
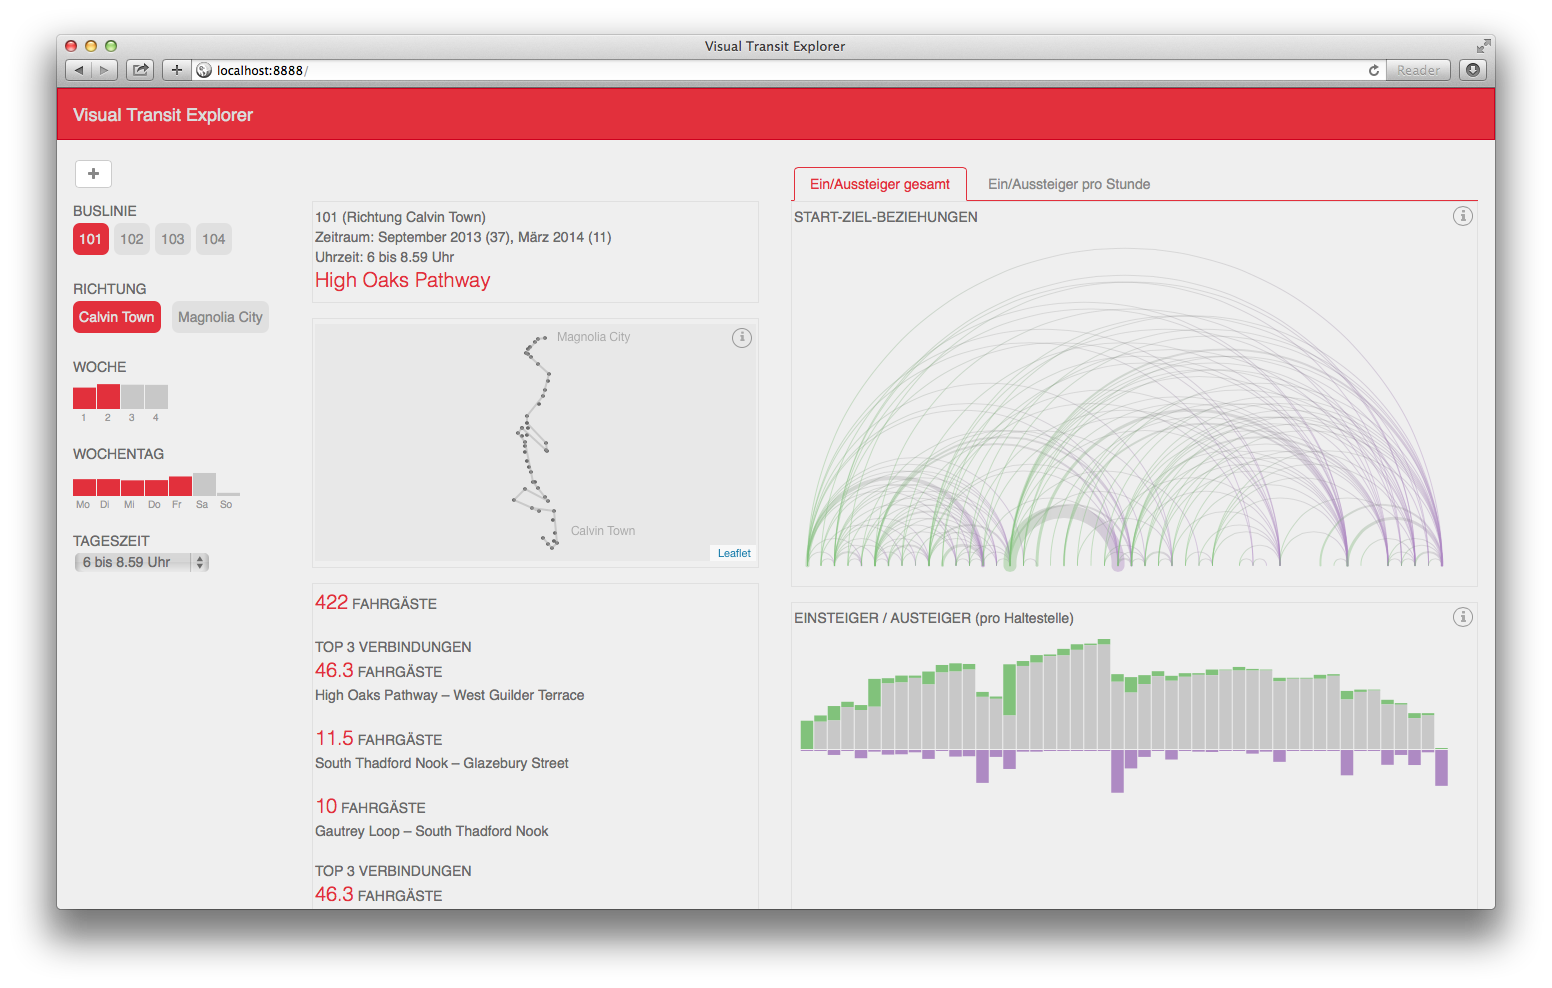
Landing page with service selected
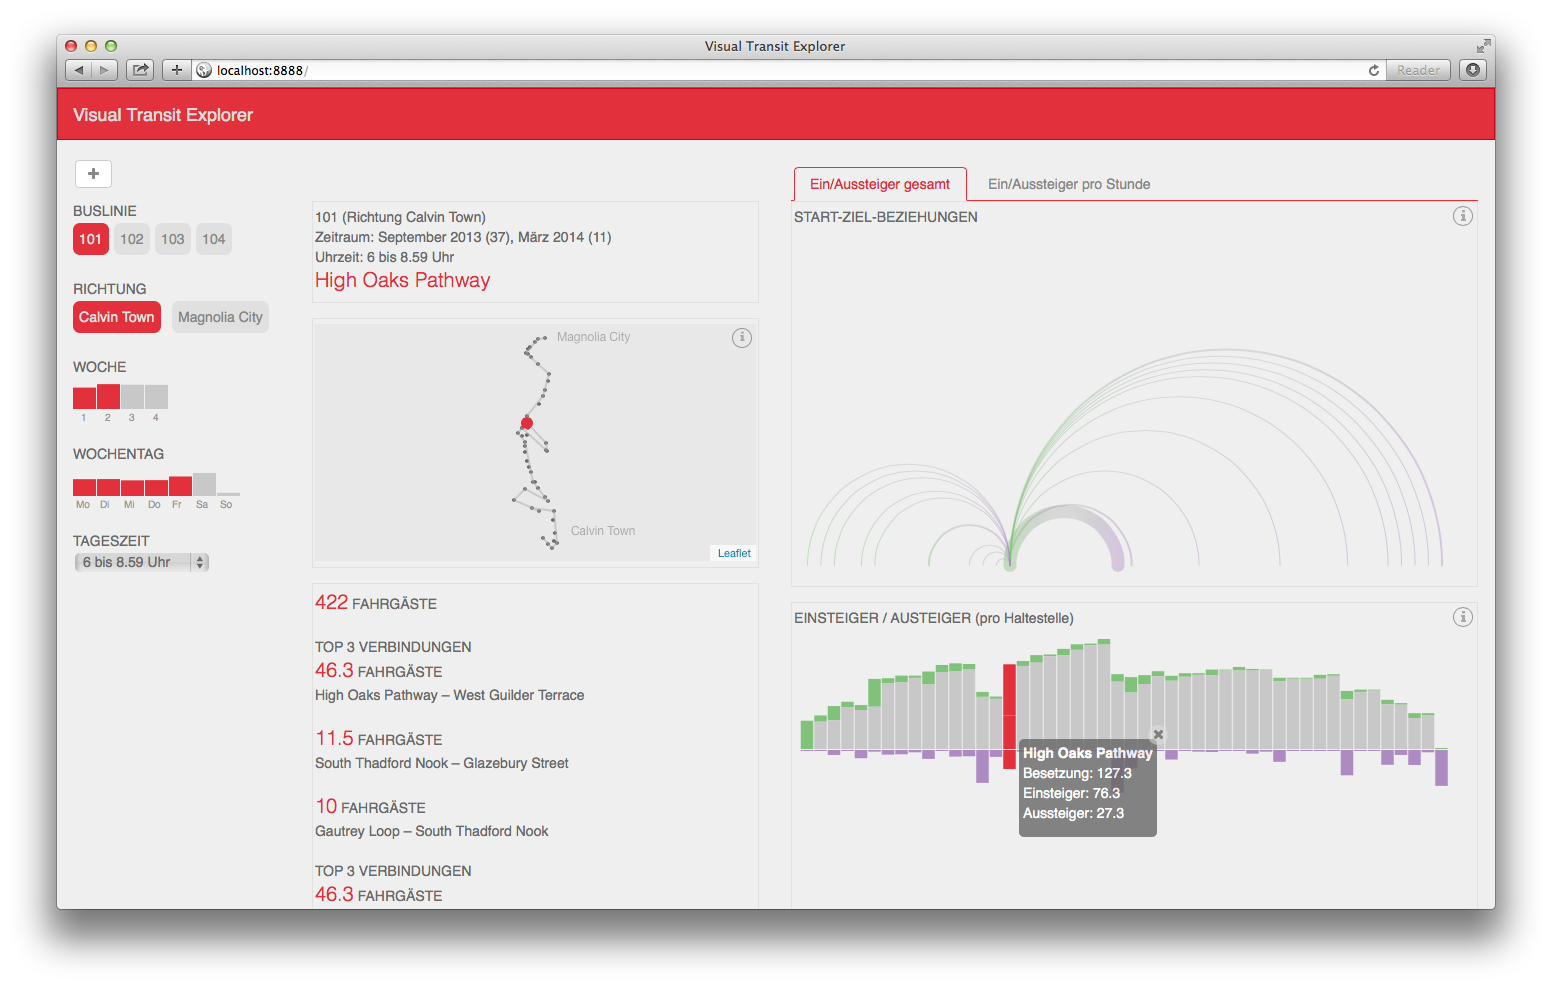
Station selected
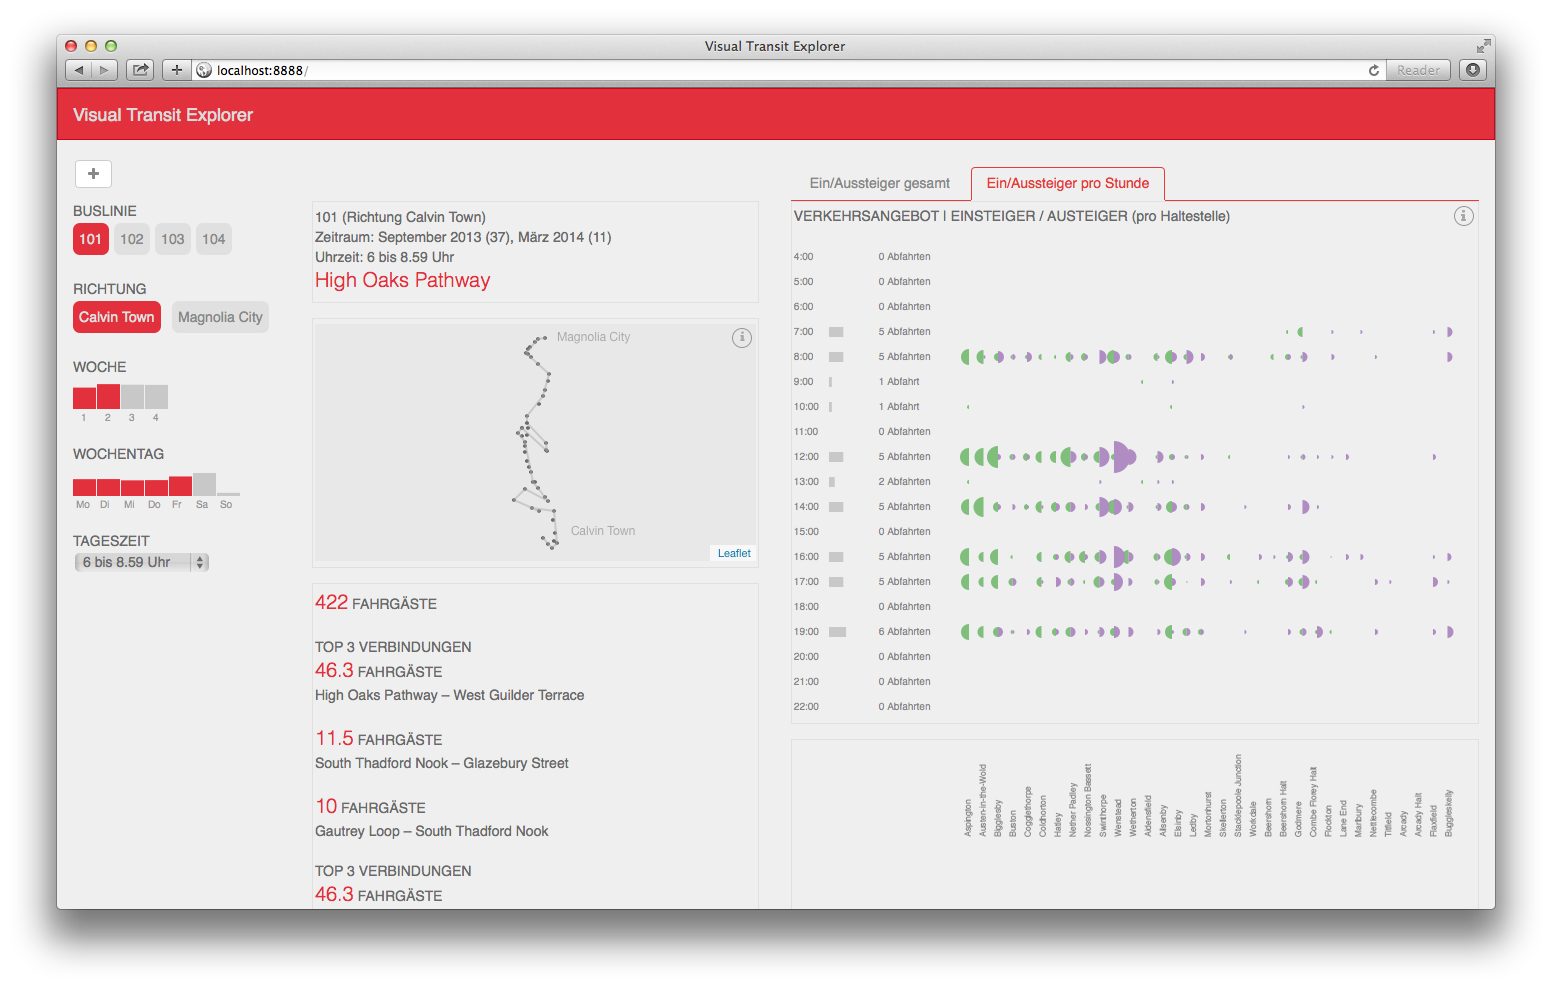
View showing on passengers per hour
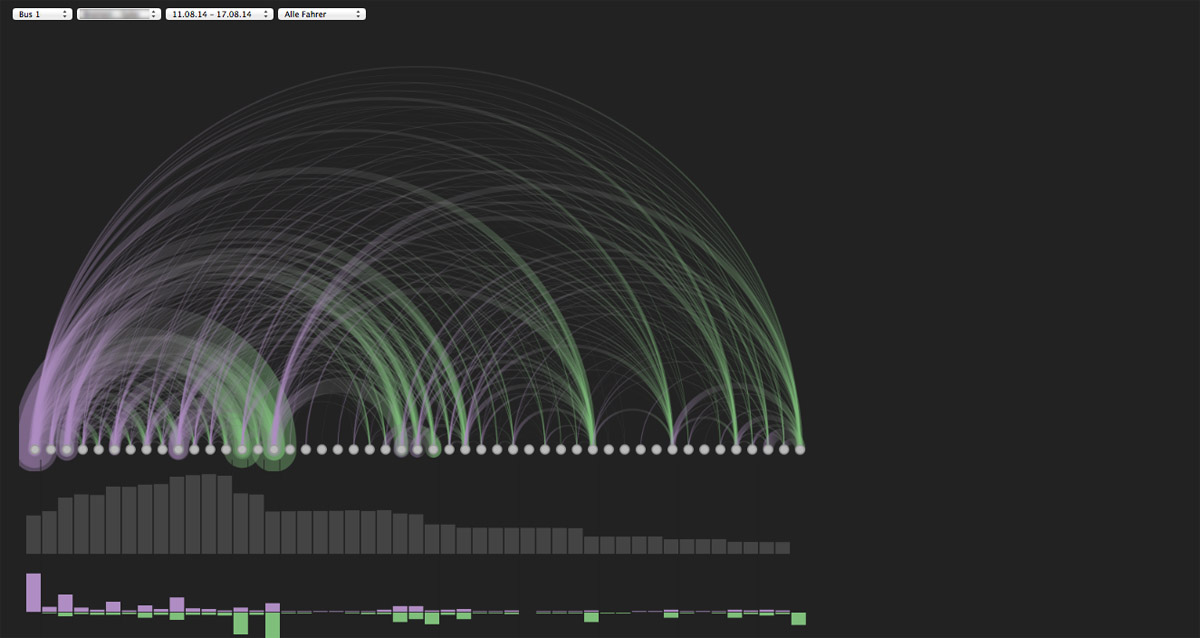
Work in progress
Work in progress showing morning rush hour pattern
Prototype for exploring visuals and several filters
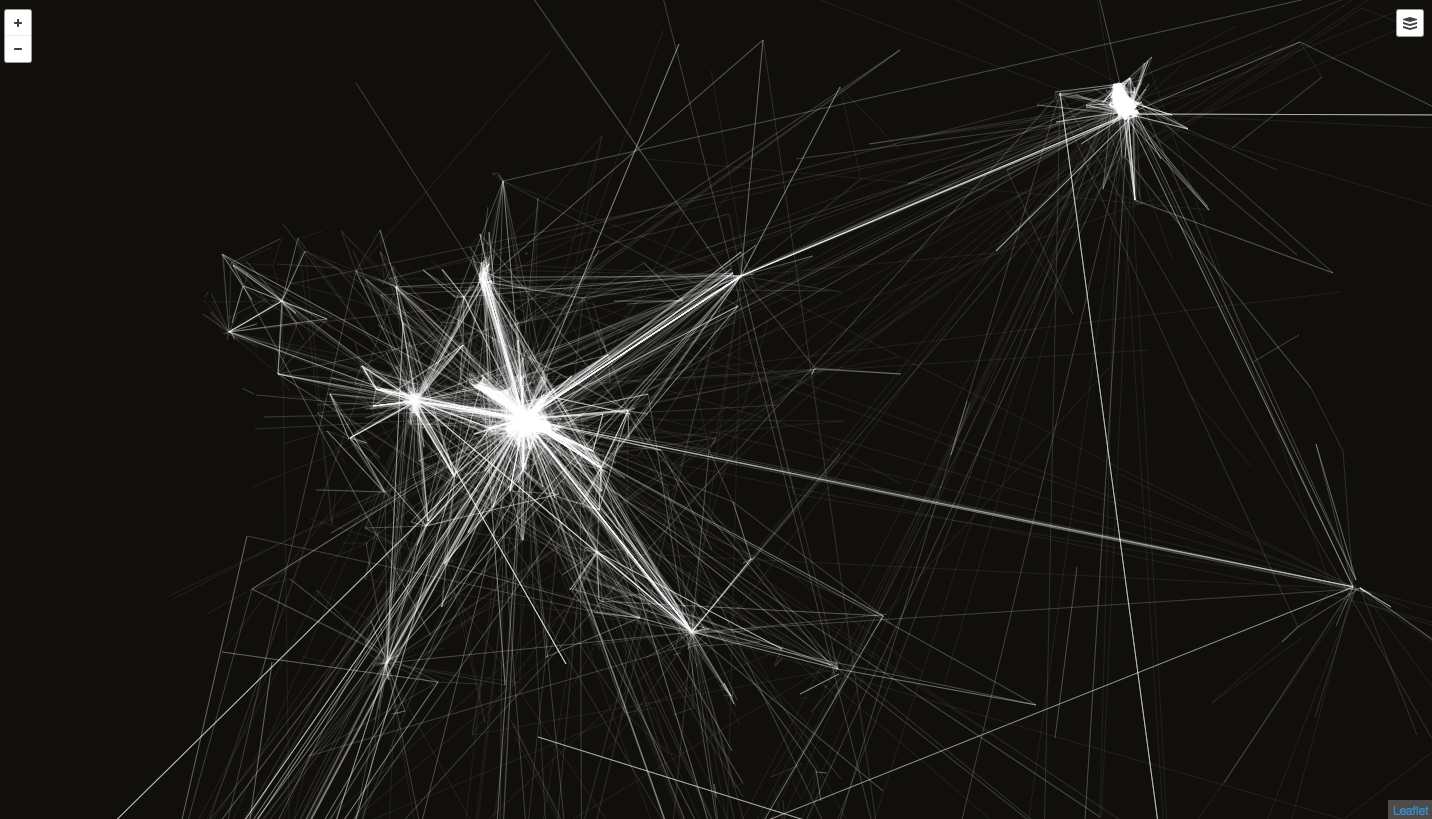
One of the first data plots
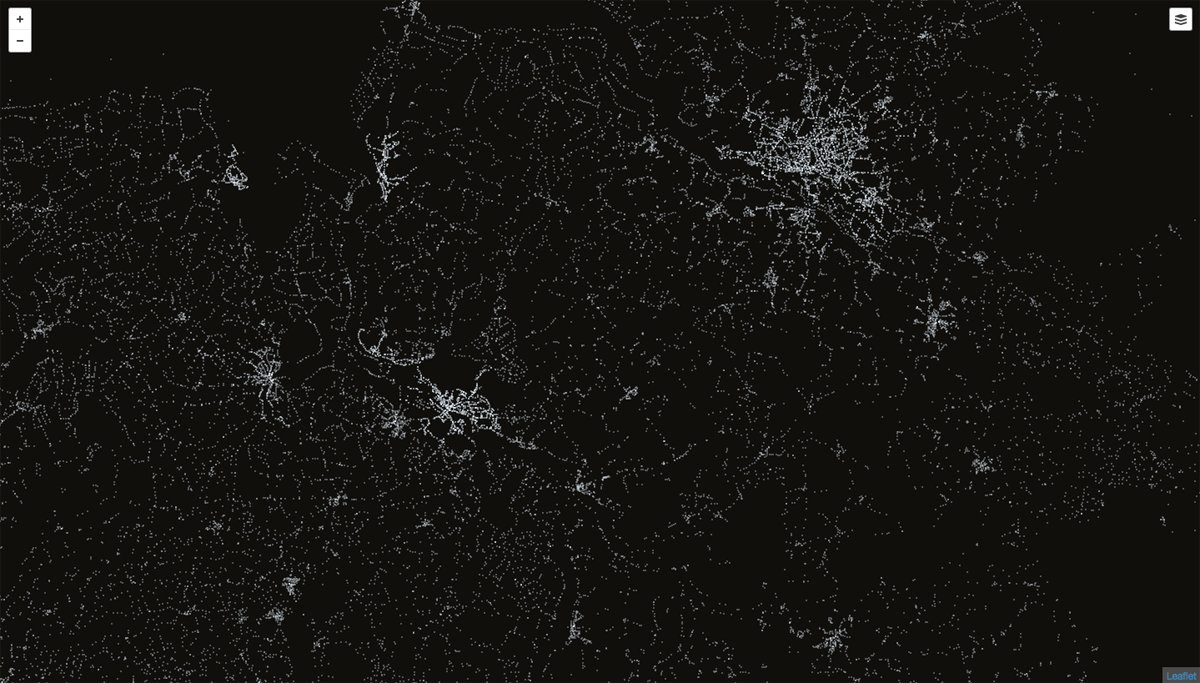
Some experiments along the way

My desk

Can't code without scribbling