Emosaic – Visualising emotion in text
Emosaic is a interactive prototype that is the result of a student project of the course Make emotions visible (German: Emotionen sichtbar machen) at the University of Applied Sciences Potsdam. The project was concepted, designed and built by Philipp Geuder, Marie Claire Leidinger, Martin von Lupin and supervised by Marian Dörk and Tobias Schröder.
There are two versions of prototypes:
Version 1 is the result of the initial course in 2014.
Prototype and concept received recognition by Digital Humanities in German speaking countries and was awarded with the DARIAH-DE DH-Award 2015.
1 minute video of Poster-Slam 2015 (German).
Version 2 was designed and developed in 2015 to exhaust the potential of the concept. It was published at DHd 2016 (German) and arXiv.
Read our paper
Emosaic: Visualizing Affective Content of Text at Varying Granularity
Version 1
Version 2
Latest version in detail
Colour mapping
We present Emosaic, a tool for visualising affective content of text documents, considering multiple dimensions of emotion and varying levels of semantic granularity.
Therefore, we introduce a colour mapping that translates any point in three-dimensional affective space into a unique colour.
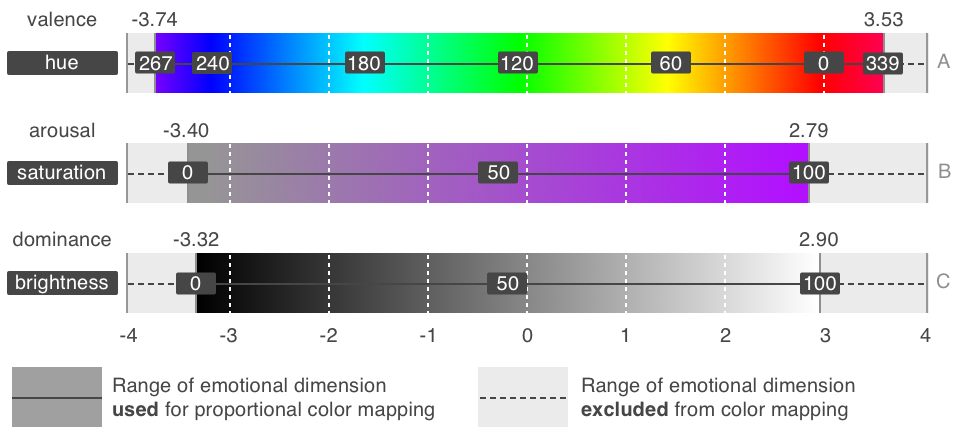
Specific color mapping for the emotional dimensions (A) valence, (B) arousal and (C) dominance. The ranges that have been used and excluded for the proportional mapping of the respective color parameter are emphasized.
Nearly all research on emotion refers to the VAD emotion model that divides emotions into three components:
- valence (the pleasantness of a stimulus)
- arousal (the intensity of emotion provoked by a stimulus)
- dominance (the degree of control exerted by a stimulus).
We searched for a mapping that transforms the three parametrical emotions into a comprehensible and easily decodable colour.
We use a database with numerical ratings for roughly 14.000 English lemmas on a scale from -4 to 4.
We decided that the HSV space (hue, saturation and value/brightness) is a very appropriate colour space for this mapping, because of its highly independent colour parameters and its similarity to the human colour perception.
We used the minima and maxima of the database for our mapping to ensure the applicable extent of the colour spectrum.
While considering current research, we assigned a custom hue scaling to valence, saturation to arousal and brightness to dominance.
Online prototype
The proposed mapping has been implemented inside the online tool Emosaic, which allows the use and inspection of user defined textual content.
The tool allows browsing through a text using semantic cues, while colour indicates affective content.
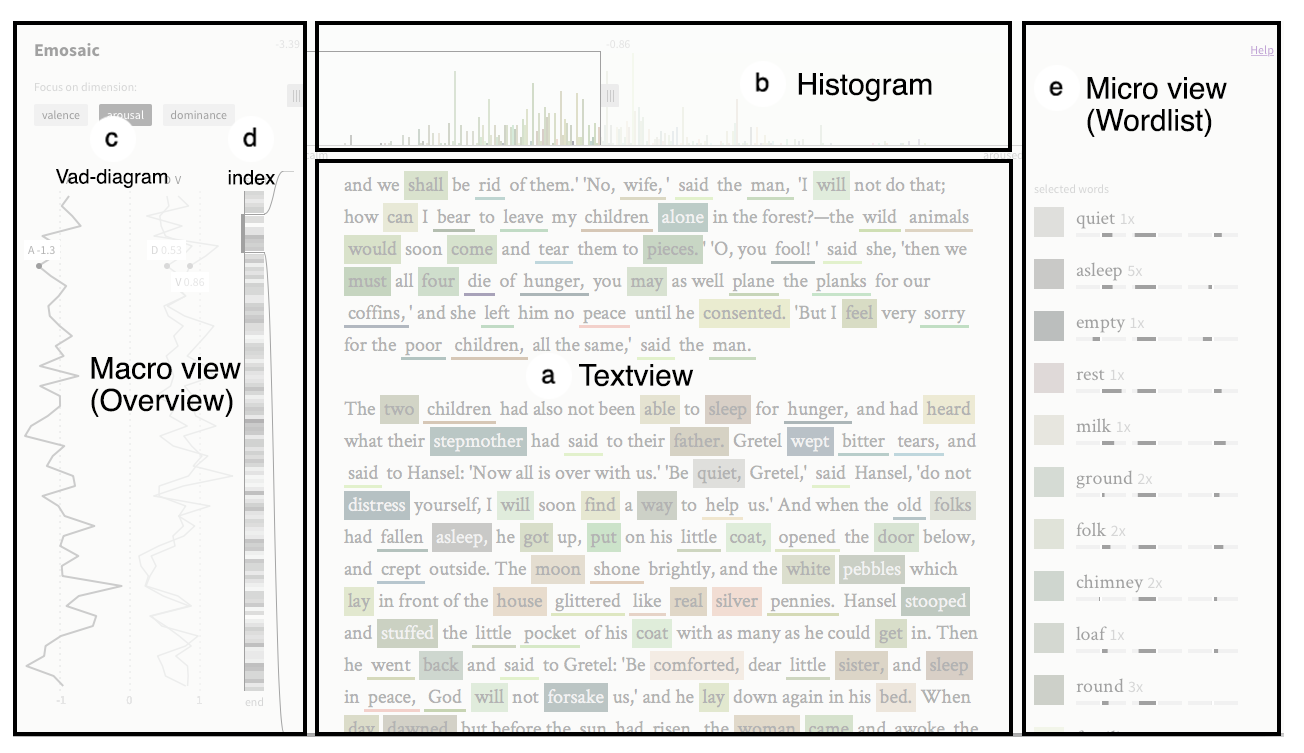
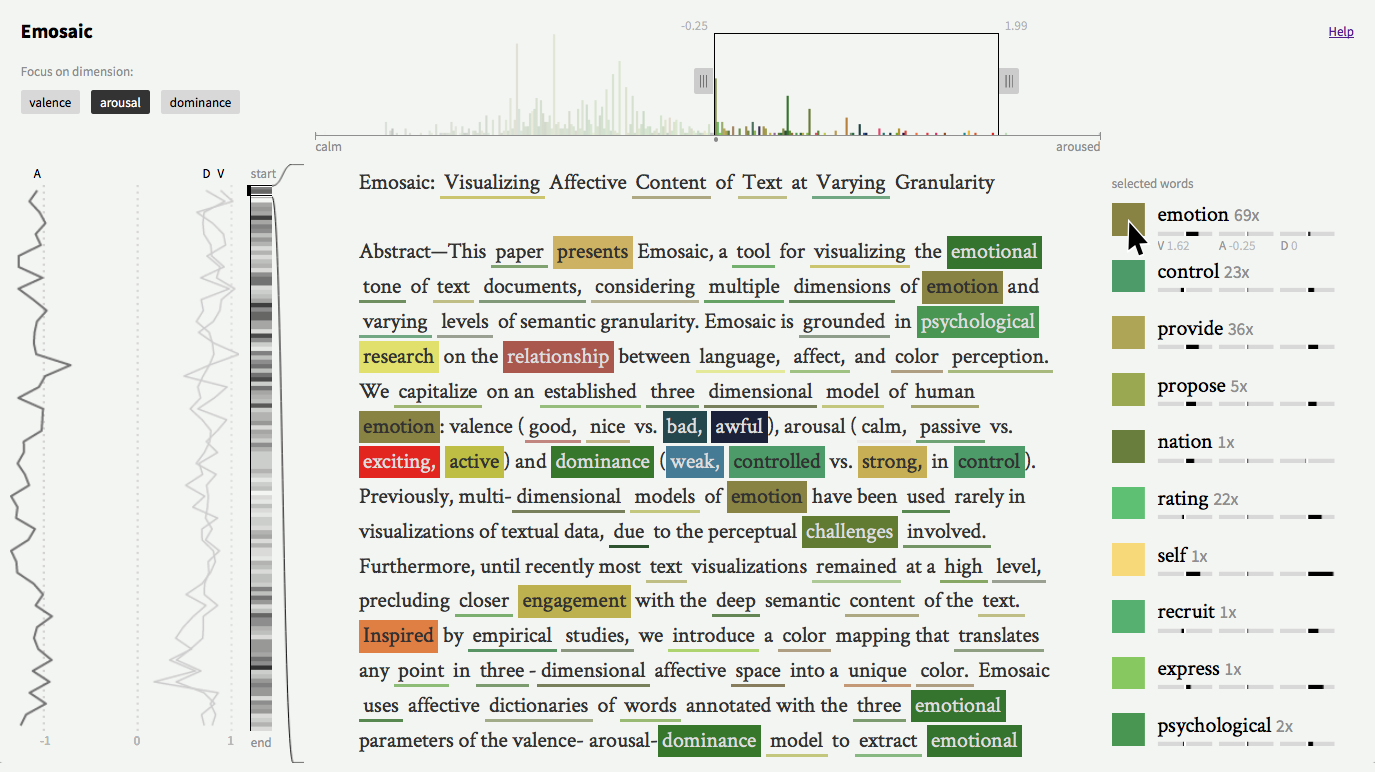
The different parts of the Emosaic interface
Text view
The text is presented inside a scrollable window, allowing for familiar reading, while emotionally relevant words are indicated through colour highlighting.
Histogram
A histogram presents the distribution of each emotional dimension. Furthermore it controls the selection and highlighting of those relevant words.
A button for each emotional dimension is available to switch the displayed parameter as desired.
When for example arousal is chosen, calm words (which are represented by a low saturation) can easily be highlighted as well as well aroused ones (which are represented by a high saturation). Equal behavior appears to the other dimensions.
Macro view
On the left side, an Overview of the emotional tone along the text is provided by line charts showing each dimension. Fluctuations in emotional dimensions can be spotted easily. Clicking leads to the respective text passage.
Also, an indication of word occurrences for the current selection is shown. A gray-scale filling indicates the amount of currently selected words in a part of the text.
Micro view
In a Detail-View on the right side, either single words or words sharing emotional similarities can be inspected.
Distinct values can be obtained by labels and charts beneath each entry.
Single words from the list can be selected to navigate through the text in a nonlinear manner.
There are two types of word-lists based on the state of selection:
- Selected words are listed when multiple words are selected in the histogram.
- Emotionally similar words that appear in the text, on the other hand, are listed when only a single word is selected.
To accomplish fluid interactivity all the views are tightly coupled.
The varying granularity of the views, combined with the semantic use of colour, allows readers to interactively explore the affective content of the text in more detail.
Video presentation of Emosaic
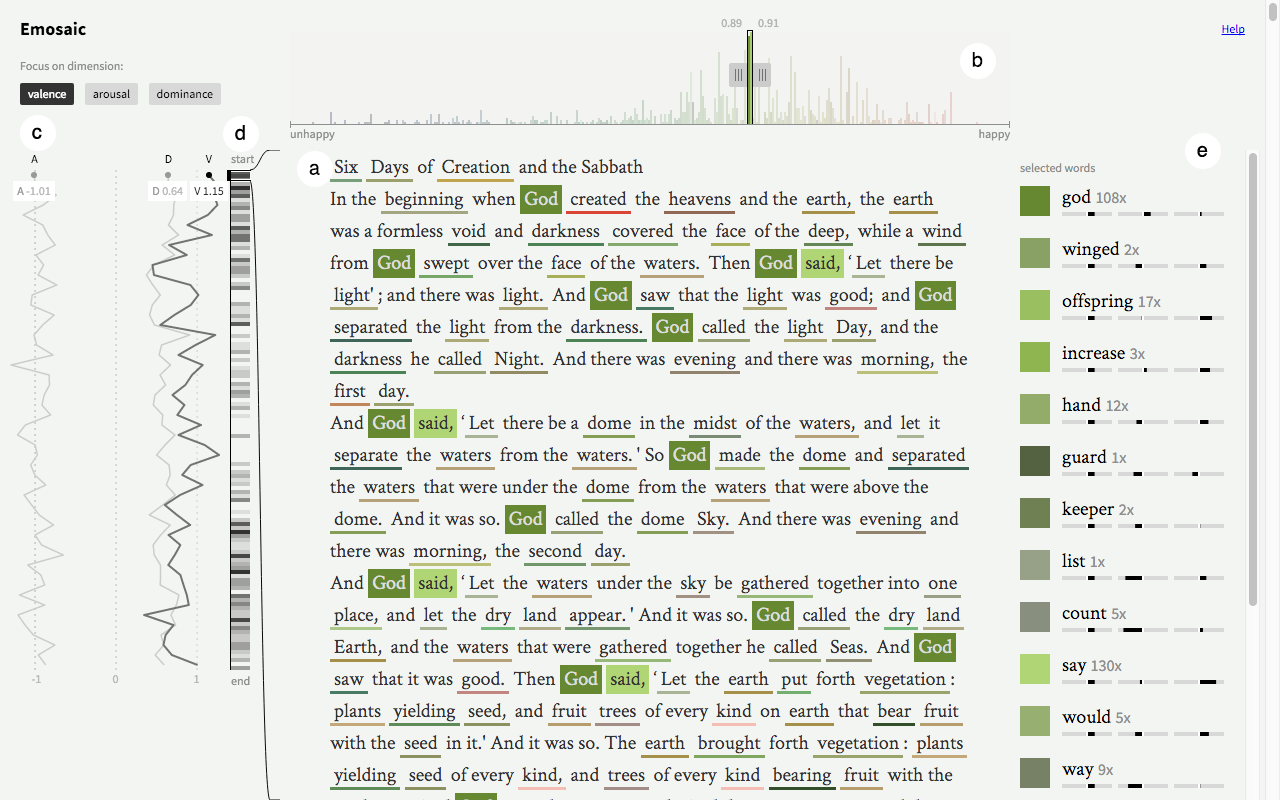
Examining the general emotional slant of the text
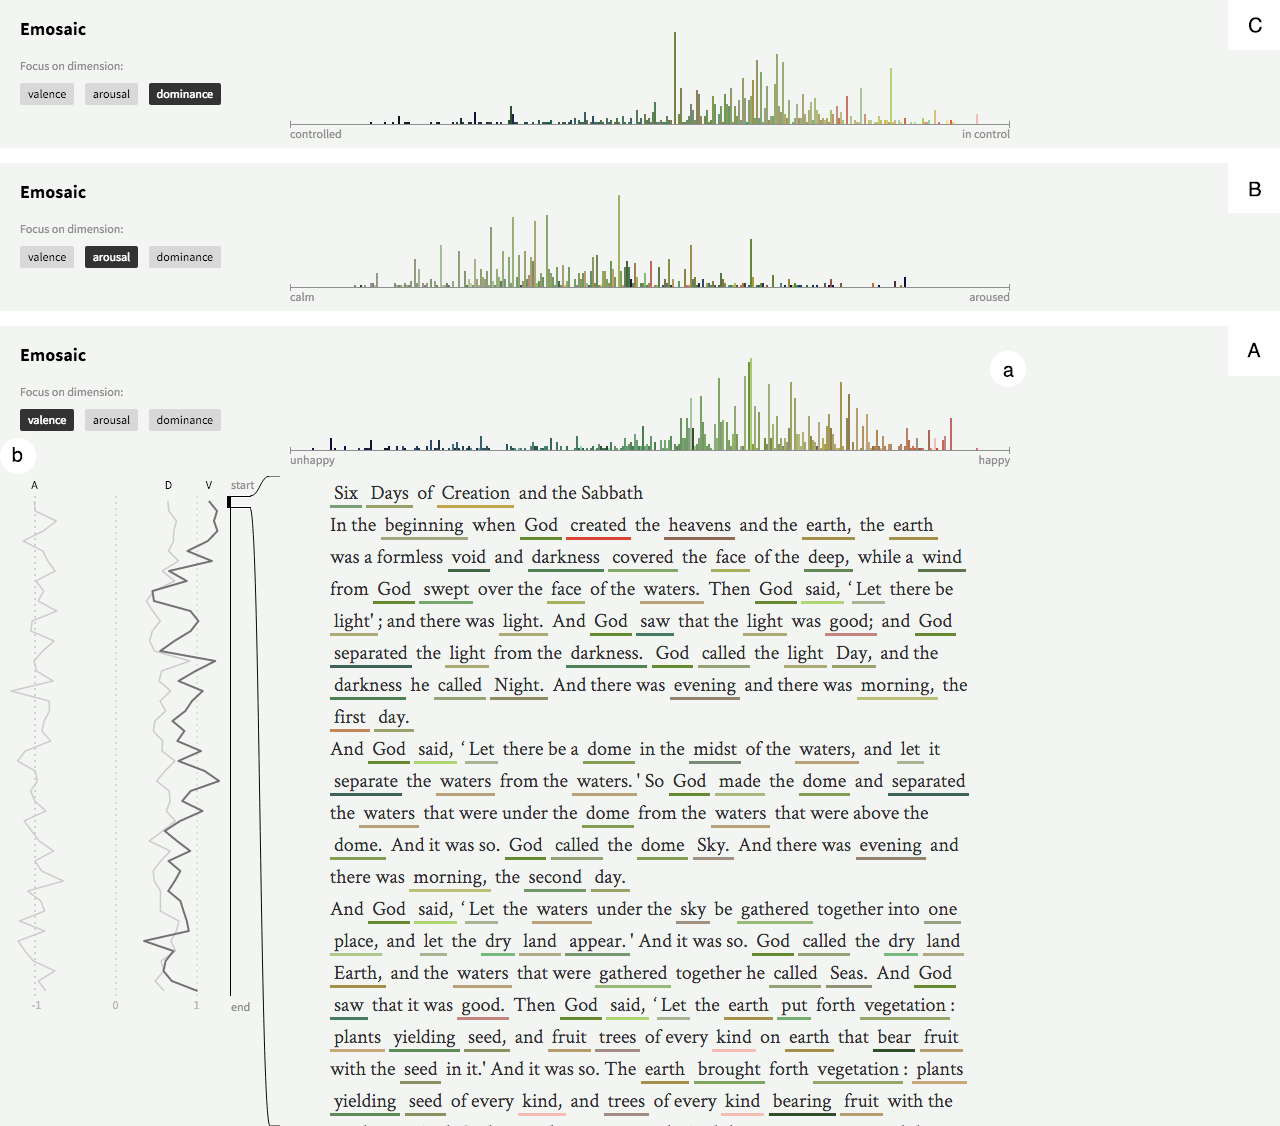
User Interface of Emosaic and different views of the Histogram.
Valence is selected by default, thus the histogram is arranged along the valence dimension (A). To get a first impression of the text’s general affective state, we can take a look at the histogram (Aa). The reader can see that the general slant of the text should be rather happy than unhappy, because most words are assigned to the positive end of the valence scale.
The viewer uses the vad-diagram (Ab) to confirm the first impression gained through the examination of the histogram and to gain additional insights about the development of emotions along the text. The valence and the dominance graphs fully consist of averages that are larger than 0. The arousal-graph consists of averages that are all about -1.
The position of the graphs confirms the first impression that the histogram provided, namely that the text generally contains words that are generally positive, in control, and calm.
Comparing peculiarities in visualisation to content
a) Text view, words that are selected are highlighted through a background color, b) selection of [0.89, 0.91] along the valence dimension in the histogram, c) vad-diagram, numerical values are displayed when hovering over that point in the graph, d) index displaying the occurrence of the selected words along text, e) list of selected words.
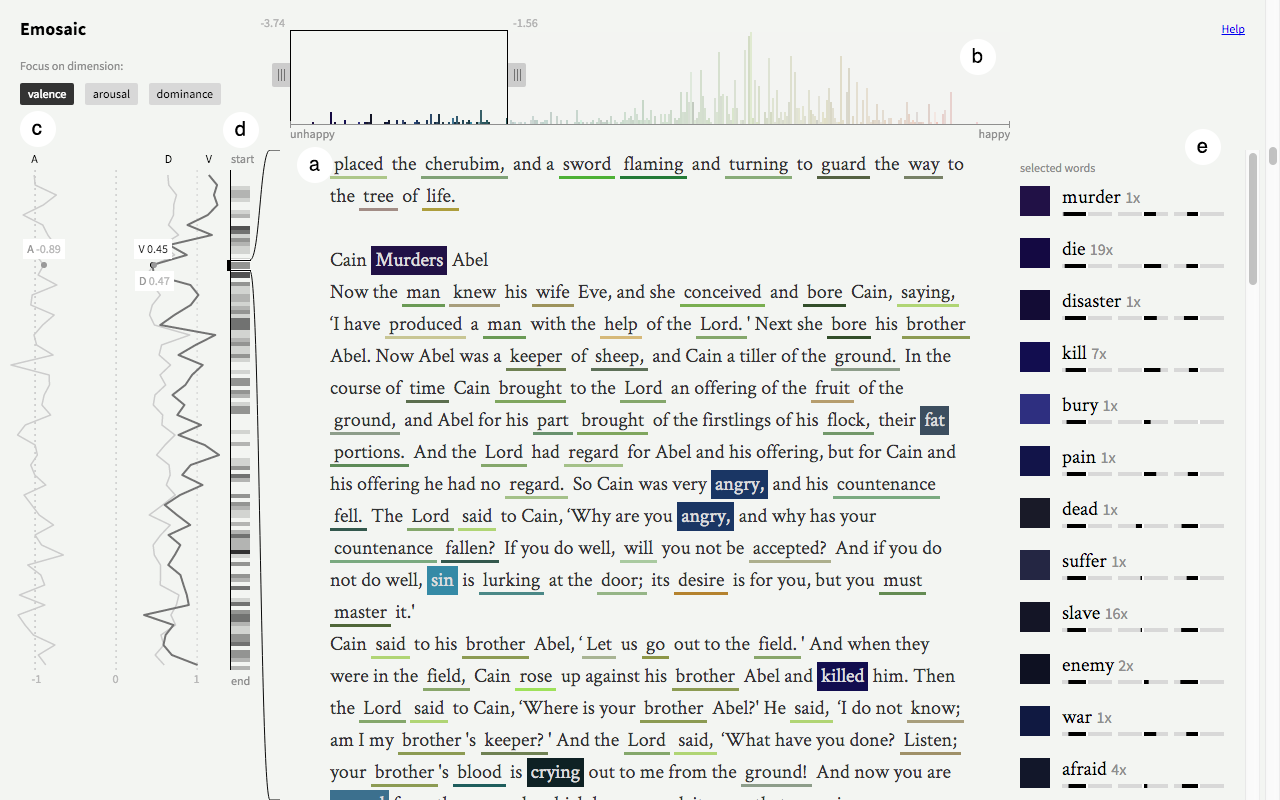
a) Textview and b) selection of [-3.74, -1.56] along the valence dimension in the histogram, c) vad-diagram d) index displaying occurrence of selected words e) micro-view with list of selected words
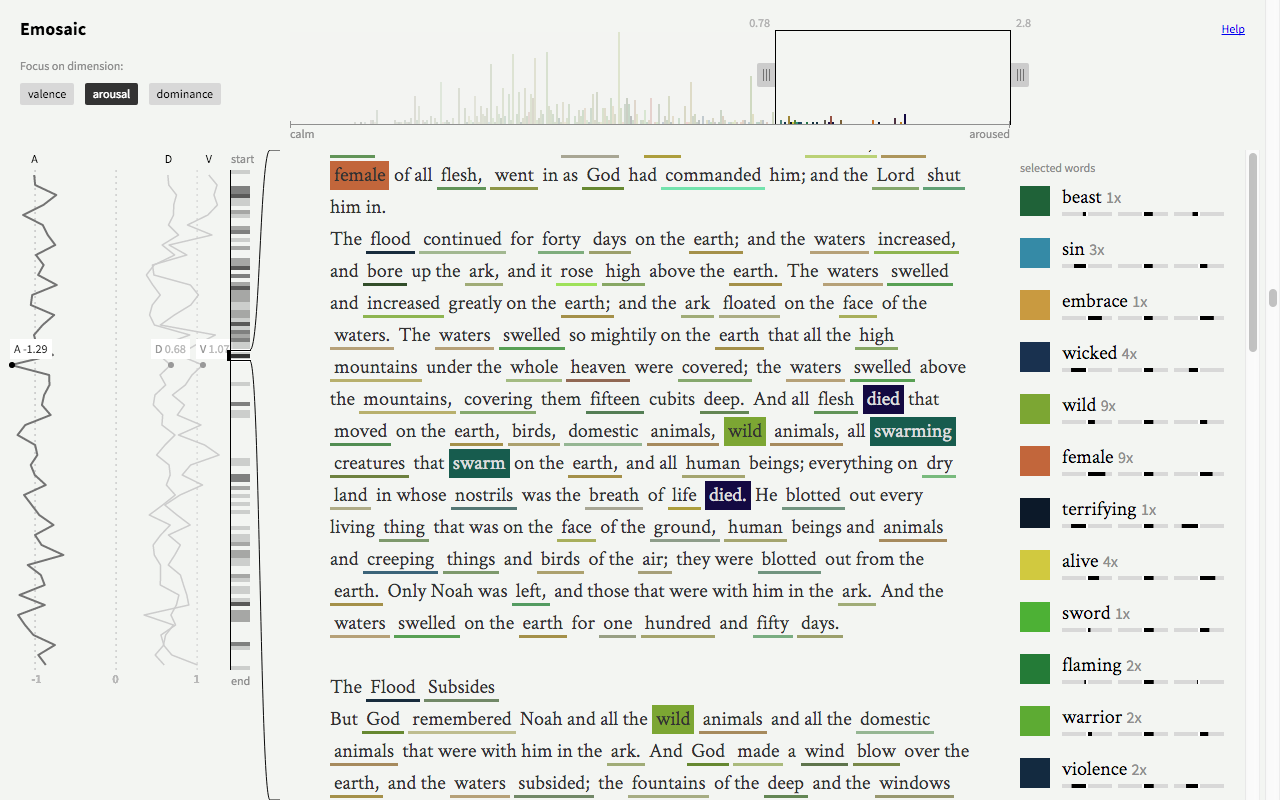
Visualisation of words of a selected arousal scope of [0.78, 2.8]
Twitter impressions
emosaic.de presented by @martinvonlupin #dhd2016 pic.twitter.com/5XgEyvSzA5
— Jan-Erik Stange (@HerrStange) March 11, 2016
DARIAH-Award 2015 for »emosaic« (http://t.co/nRJQiIJEaO) @martinvonlupin @nrchtct @FHPotsdam @idpotsdam pic.twitter.com/Pw0rvxFjgY
— Marie Leidinger (@MarieLeidinger) March 4, 2015
Impressum // © 2020 - Martin von Lupin