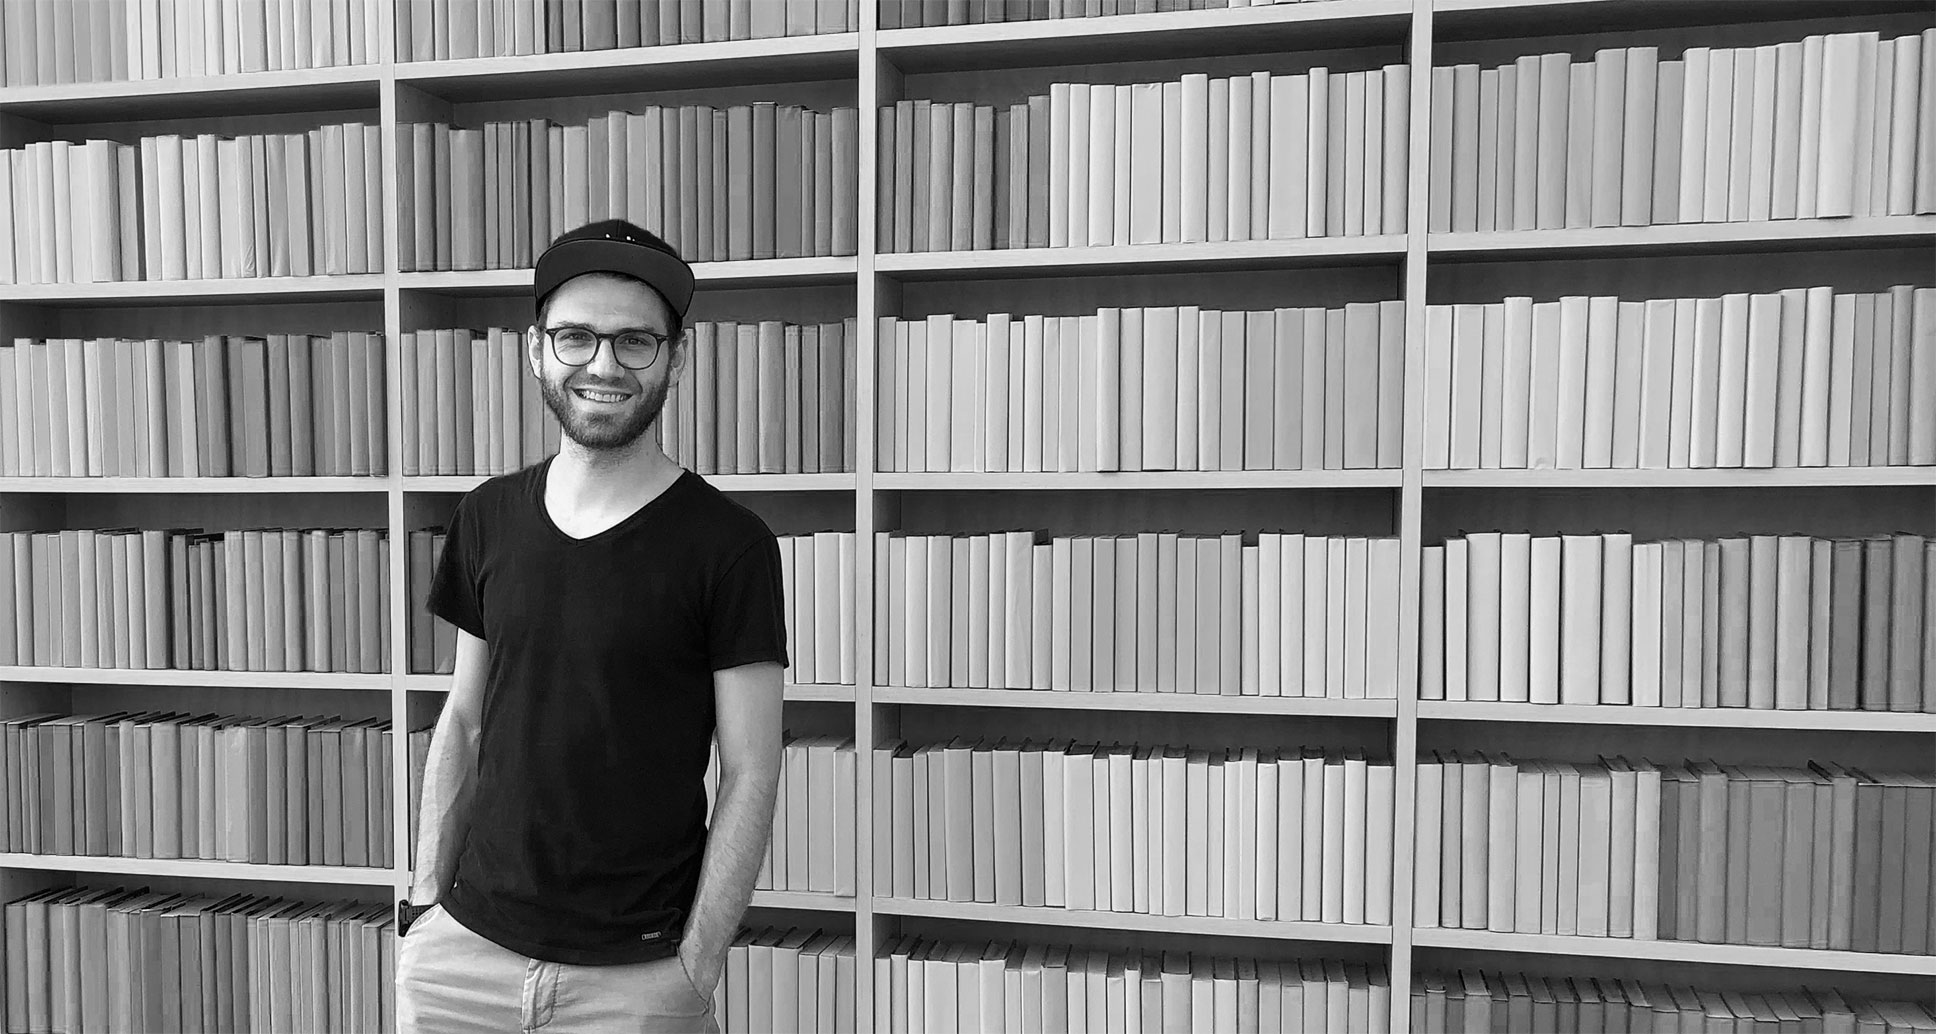
Vita
At the moment I'm working as UX/UI Designer at the datavis studio Small Multiples in Sydney.
2016 Bachelor of Arts in Interface Design from the University of Applied Sciences Potsdam, Thesis: "Narrative Photo Browsing – Using large personal photo collections for reminiscing and autobiographical refecting" supervised by Marian Dörk and Sebastian Meier.
2015-2016 Student employee at civity Management Consultants in Berlin. I mostly do UI design, data visualization and map design.
2015 Freelancing for Golden Section Graphics in Berlin. I supported the team in web development and responsive web design.
2014-2015 Internship at civity Management Consultants in Berlin. I built an interactive web application for public transport analysis. Therefor I aggregated and visualized user generated timetable information data.
2013 Semester abroad at Malmö University in Sweden. I attended the interaction design program and focused my studies on game design, using Microsoft Kinect.
2010-2016 Interfacedesign study at the University of Applied Sciences Potsdam. I focus on physical interaction, UX/UI design and data visualization.
2007-2010 Training as a digital media designer at bsf swissphoto, a company located near the airport Berlin Schönefeld, which captures geo data from aerial photographs for customers like Google, Microsoft or Deutsche Bahn.
Publications
Philipp Geuder, Marie Claire Leidinger, Martin von Lupin, Marian Dörk, Tobias Schröder
Emosaic: Visualizing Affective Content of Text at Varying Granularity. arXiv:2002.10096 [cs.HC]
(
Read full text paper
)
von Lupin, M., Geuder, P., Leidinger, M., Tobias S., Dörk, M. Emosaic –
Visualisierung von Emotionen in Texten durch Farbumwandlung zur Analyse
und Exploration [Emosaic – Visualizing Emotions in texts through color transformation for analysis and exploration]. DHd 2016: 263-266.
(
Body of Abstracts
)
Gortana, F., Kaim, S., von Lupin, M., Nagel, T. Isoscope – Visualizing
temporal mobility variance with isochrone maps. Poster Abstracts of IEEE
VIS 2014.
(
paper,
website,
demo video,
conference video
)
Awards
DARIAH-DE Digital Humanities Award 2015
Award for the student project emosaic together with Philipp Geuder and Marie Claire Leidinger, supervised by Marian Dörk and Tobias Schröder
University of Applied Sciences Potsdam, DARIAH-DE
Talks
The Lorem Ipsum of data visualisation - How to design data-driven wireframes
UX Australia, September 2019
Presentation slides (PDF)
Conference website
Creating highly polished and responsive graphics in R
Meetup, Sydney Users of R Forum (SURF), June 2019
Presentation slides (PDF)
Meetup description
Data Futures: a live experiment about data ownership, ethics and our everyday lives
Vivid Ideas Exchange, Museum of Contemporary Art, May 2018
Talk and live experiment at Vivid together with Andrea Lau from Small Multiples, based on concept by Dominikus Baur and Daniel Goddemeyer.
We need to google ourselves (news.com.au)
Article by Small Multiples
Event website
Isoscope
Meetup, Maptime Berlin, February 2015
Presentation slides (PDF)
Teaching
Data Visualisation for Beginners: Two-Part Workshop Series
General Assembly, 2016–2018
Instructor profile
Exhibitions
Frieder Nake - Licht ins Dunkel
25x50 years of computer art
University of the Arts Bremen
16. - 28. December 2013
Selected articles
Nokia HERE
Made with HERE: Isoscope shows your scope for travel
by Ian Delaney
FlowingData
Your mobility at various times during the day
by Nathan Yau
Fast Company - Co.Design
How Easy Is It To Get Around In Your City? Play With This
Interactive Viz To Find Out
by Shaunacy Ferro
The Atlantic Cities
A Striking New Way to Visualize Mobility
by John Metcalfe
